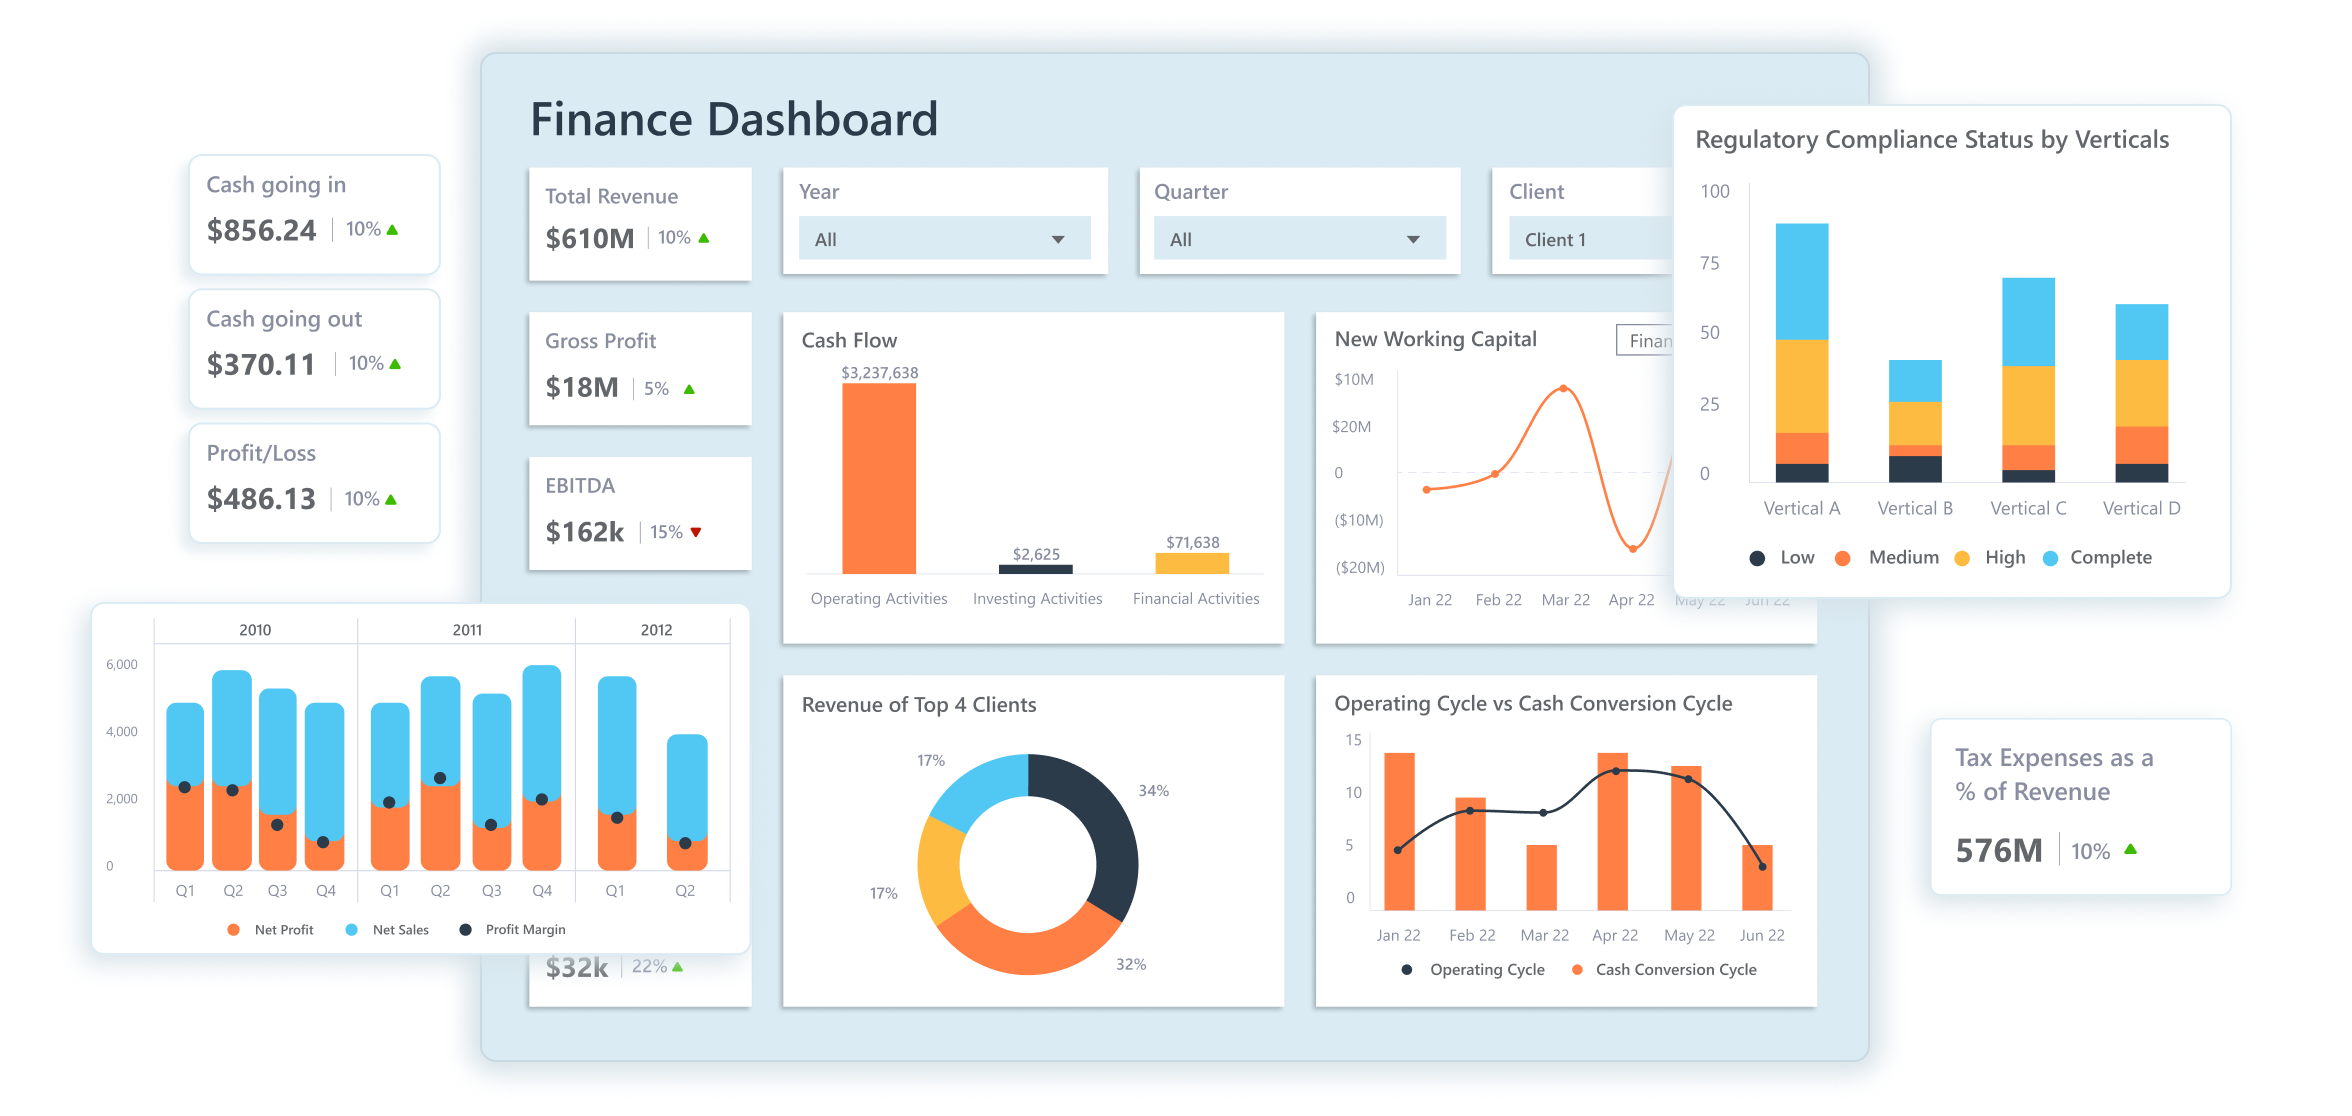

As data becomes increasingly central to business, understanding financial information is more important than ever. Dashboards turn complex data into clear insights, helping organizations make smarter decisions.
Finance dashboards gather data from multiple sources to offer real-time visibility into an organization's financial state. They present key metrics for informed decision-making, providing clear, automated reports suitable for both analysis and presentations. Designed for clarity, these dashboards help finance professionals and leaders identify performance patterns, growth opportunities, and respond to financial challenges with confidence.
Boost in revenue through sales and customer insights.
Reduction in the operational and overhead expenses.
Improvement in the bottom-line profitability.
Improvement in cash flow management and forecasting.
Reduction in the decision-making time.
Reduction in the audit preparation time.
At NeenOpal, we focus on delivering comprehensive financial dashboards tailored to your business needs, regardless of the data sources, ETL processes, or reporting tools involved. Our expertise ensures seamless integration and transformation of data, enabling accurate and actionable insights without the complexities of underlying technologies impacting your final dashboard experience.


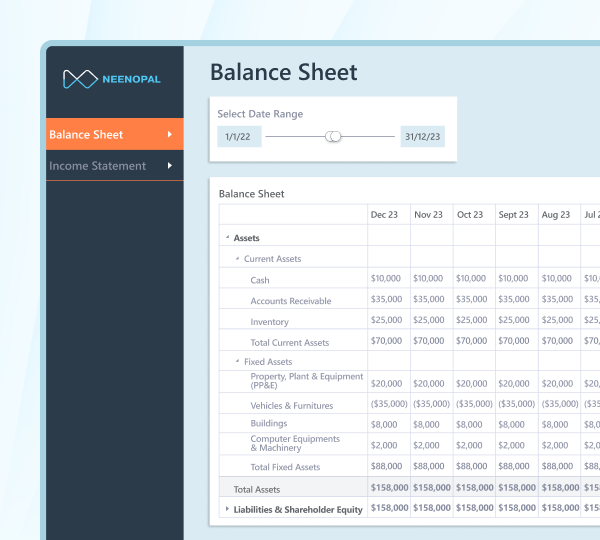
A Balance Sheet dashboard provides a clear view of financial performance by making it easy to
analyze trends and track changes while allowing seamless comparison of data over time.
1. View the balance sheet and compare it over time to gain deeper insights into
financial health and performance.
2. Access data in monthly, quarterly, or annual views for customized analysis and a
comprehensive understanding of financial trends.
3. Track how changes in one item impact
others, and identify trends and variances in line items to effectively monitor performance.
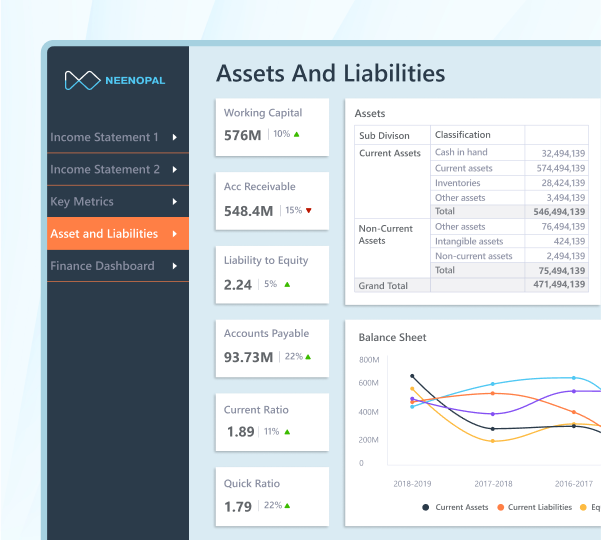
An Assets and Liabilities dashboard highlights an organization’s financial position by showing
the balance between assets owned and liabilities owed, while tracking changes over time.
1. Provides a clear overview of total assets and liabilities to assess the
organization’s financial position and overall stability.
2. Tracks changes in assets and liabilities over time, helping identify key trends, financial
patterns, and potential areas of concern for better forecasting and planning.
3.
Allows comparison of asset and liability categories, offering insights and real-time data to
support informed decision-making and proactive risk management.

A Cash Flow Summary dashboard provides an overview of cash balances, movements from operations,
investments, and financing activities, along with key financial metrics such as profit and loss
(P&L) and gross profit.
1. Visualize cash flows from operating, investing, and financing activities in one
clear view, giving a complete picture of liquidity.
2. Track cash inflows and outflows over time to identify patterns, helping to manage cash
positions effectively.
3. Compare actual cash flows against budgets or forecasts to
quickly identify variances and take corrective action.
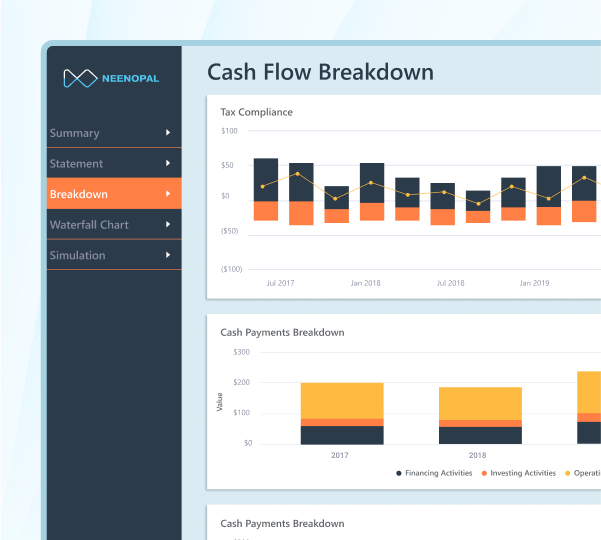
A Cash Flow Breakdown dashboard analyzes cash inflows and outflows, including tax payments for
operating,
investing, and financing activities. It improves payment tracking, liquidity management, and
compliance.
1. Tracks tax compliance and payments to ensure accurate financial reporting and
prevent errors.
2. Monitors payment patterns over time to improve financial planning and predict cash flow
requirements.
3. Supports effective liquidity management while complying to regulatory
compliance norms for financial stability.

A Cash Flow Waterfall Chart visually represents the increases, decreases, and total cash flow
over a specific period.
1. Displays cash inflows, outflows, and total balance at a glance, providing a
comprehensive view of cash flow patterns.
2. Underlines major contributions to rises and declines in cash flow, helping in identifying
areas of financial growth and concern.
3. Provides a clear and complete breakdown of net
cash flow, allowing for better informed and strategic financial decisions.

Cash Flow Simulation not only tracks the actual inflow and
outflow of cash but also enables scenario analysis to simulate the impact of changes in
financial metrics on profitability.
1. By integrating a visual scale to highlight changes in revenue or expenses,
users
can instantly observe their effect on profit margins, helping stakeholders make
informed decisions.
2. The intuitive interface helps businesses forecast, plan, and adjust their financial
strategies, ensuring growth and resilience in changing economic conditions.
3. With
real-time data updates, businesses can quickly respond to financial shifts, minimizing risks and
seizing opportunities for improvement.
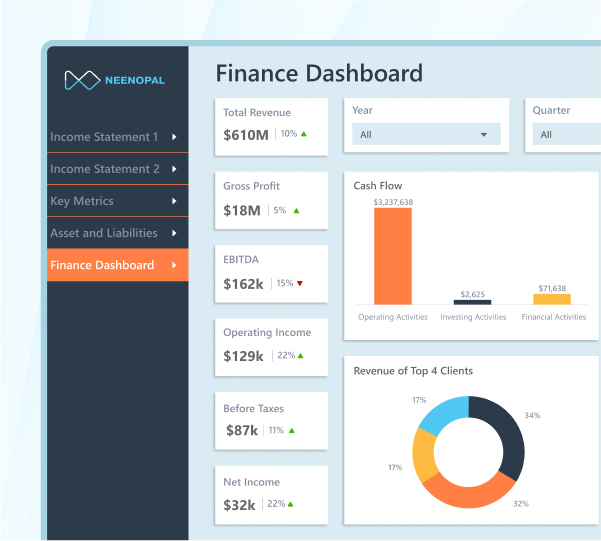
A Financial Dashboard helps businesses gain a clear overview of their financial performance by
tracking key metrics and client contributions. It enables detailed analysis and easy tracking of
revenue, profitability, and client impact.
1. Provides a snapshot of key financial metrics, such as total revenue, gross
profit, EBITDA, and net income, all in one place.
2. Analyze the contribution of top clients to overall revenue with clear percentage breakdowns,
aiding in client performance monitoring.
3. Filter the dashboard by year, quarter, or
client to focus on specific periods or stakeholders for more targeted analysis.

The CFO Dashboard 1 gives a quick overview of compliance and risk metrics, helping teams stay on
top of regulatory requirements.
1. It allows users to monitor compliance performance at a glance, supporting
proactive risk management and regulatory adherence.
2. Provides a comprehensive view of compliance and risk metrics, consolidating key information
such as compliance rates, tax expenses, and financial transaction volume.
3. Offers a
snapshot of foreign exchange exposure, assisting teams in assessing currency risks and making
informed financial decisions.
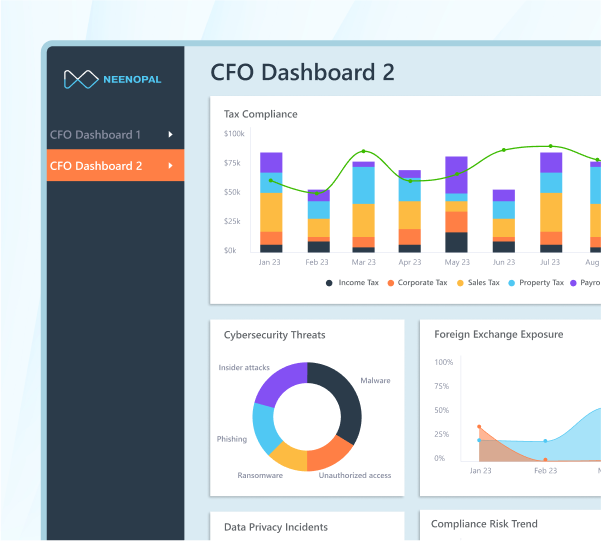
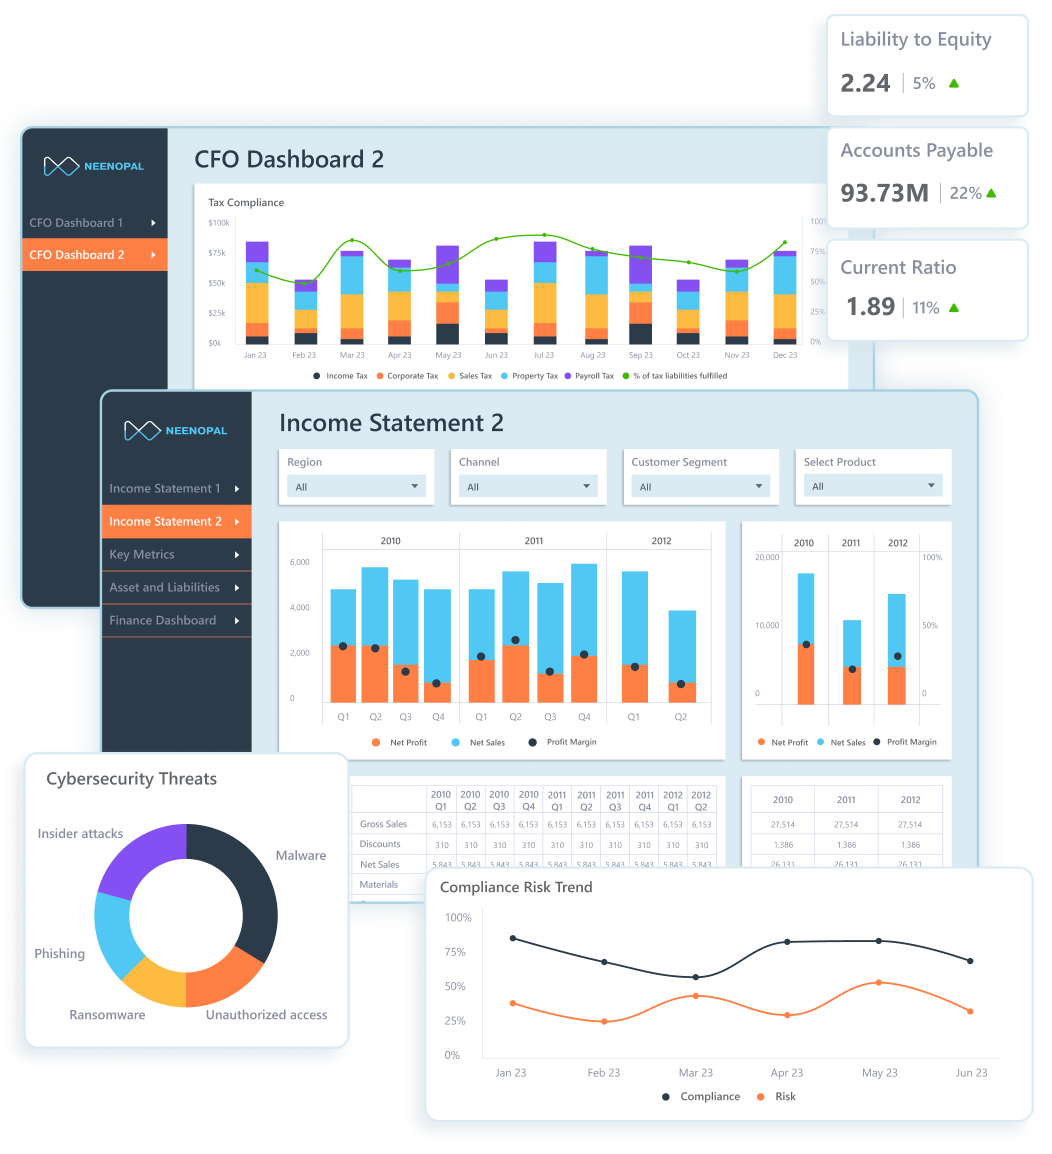
The CFO Dashboard 2 emphasizes time-based trends, supporting strategic planning and
decision-making for compliance and financial risks.
1. With a focus on time-based trends, this dashboard supports strategic planning
and decision-making around compliance and financial risks.
2. Tracks compliance trends and risks over time, offering insights into tax compliance,
cybersecurity threats, and data privacy incidents.
3. Provides a foreign exchange
comparison tool, helping finance teams manage currency exposure and related risks.
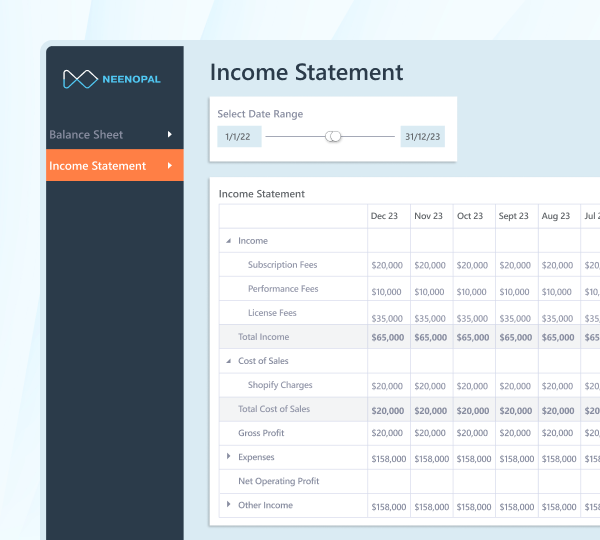
The Income Statement dashboard displays an organization's financial performance by measuring
sales,
costs, and profits over time. It enables stakeholders to quickly evaluate profitability and
identify opportunities for improvement.
1. An overview of income and expenses, with a clear visual representation of net
profit/loss.
2. Compare P&L across periods to track revenue and expense trends over time.
3. Access
multiple views to see the same data displayed monthly, quarterly, or annually.
4.
Instantly identify variances between actuals, budgets, and forecasts to keep track of
performance against targets.
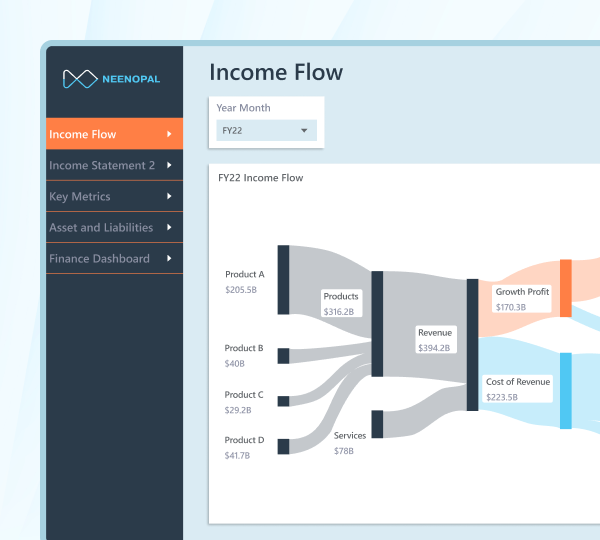
The Income Flow dashboard depicts the flow of revenue and expenses, highlighting how each
category
contributes to the overall profit or loss. The Sankey chart shows the link between income and
multiple cost factors, allowing you to determine the most important variables of financial
performance.
1. Displays revenue, expenses, and net income clearly.
2. Uses a Sankey chart to show income flow and category contributions.
3. Compares income
statement data across periods.
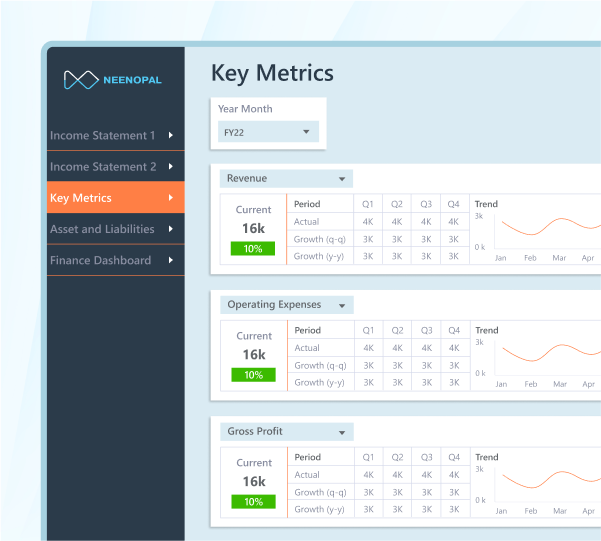
The Key Metrics dashboard provides a quick overview of essential financial figures, including
revenue, operating expenses, and gross profit, helping to monitor performance and make
data-driven decisions.
1. Displays total revenue for a clear picture of business income.
2. Tracks operating expenses to evaluate cost efficiency.
3. Shows gross profit to
determine profitability.
4. Helps identify financial trends and inform strategic
decisions.
5. Offers a snapshot of key financial data in one place for quick insights.
This demo presents essential financial reports, including the Balance Sheet, Profit and Loss, and Cash Flow, alongside detailed KPIs and insights, all in a clear and intuitive format. Explore how our dashboards can enhance your understanding of key financial metrics and drive the optimization of your financial strategy.
We use modern ETL tools, data warehouses, data visualization tools, and cloud platforms to offer seamless, data-driven solutions. These services provide efficient data processing, storage, and analytical reporting for informed decision-making. To learn more or discuss how we can enhance your data strategy.
ETL Tools


Data Warehouses


Data Visualization Tools


Cloud Platform


We provide core reporting features that enable detailed drill-downs for in-depth analysis. Our custom metrics allow businesses to track performance accurately, aligned with specific needs and goals. These solutions help businesses make data-driven decisions. To discover how we can support your reporting needs.

Provides a snapshot of assets, liabilities, and equity, offering valuable insights into financial stability, liquidity, and overall organizational health.

Monitors revenue and expenses over time, helping track profitability and support decisions on cost control and revenue generation.

Shows cash inflows and outflows from operations, investments, and financing, helping in effective cash management and decision-making.

Delivers in-depth analysis of the core reports with additional insights to support data-driven decisions and strategic planning.

Displays critical ratios like liquidity, profitability, efficiency, and leverage, allowing you to assess financial performance at a glance.

Presents data through interactive charts, tables, and visualizations to explore financial details and identify trends, and uncover insights.

Tailored financial metrics and dashboards are available for sectors such as SaaS, healthcare, financial services, retail, and manufacturing.

We provide industry-specific insights aligned with key performance indicators tailored to sectors like SaaS, healthcare, finance, retail, and manufacturing.

These specialized metrics empower businesses to make data-driven decisions in their specific field, driving efficiency, growth, and competitive advantage.
A Business Intelligence (BI) roadmap is a plan that guides how to set up and use data analytics tools and processes to gain valuable insights and make informed decisions. It helps organizations build a clear path for integrating data solutions that support long-term growth and success. By aligning technology with business goals, it fosters efficient data management and drives continuous improvement. Learn more.