
Webinars have emerged as a key tool in content marketing
Engaging one-on-one with current and future customers in real-time can be highly beneficial to the business. Webinar marketing is a kind of lead magnet, which makes it possible to do this in an inexpensive and cost-saving manner. It lets the business connect with an interested audience, to interact with them personally in the virtual platform.
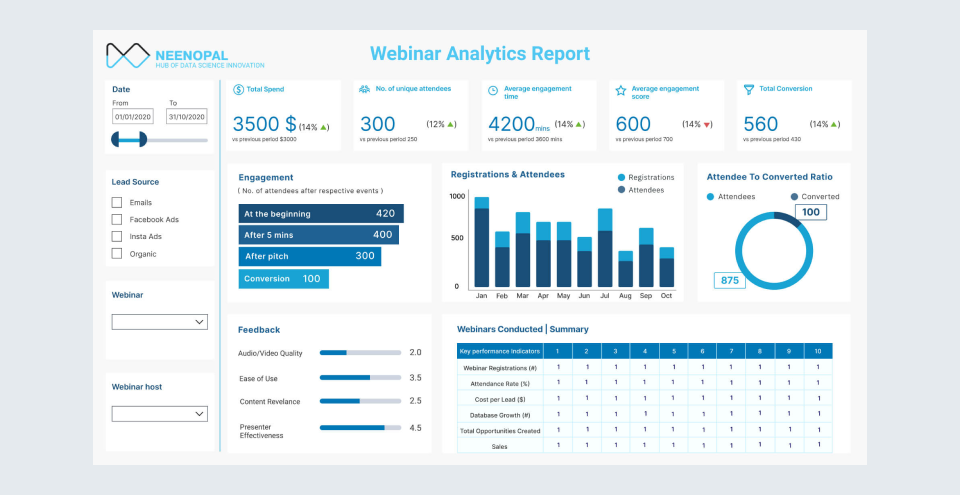
The webinar dashboard provides a summary of the webinars conducted over the selected time period. This dashboard captures overall details about the webinar, engagement data and the impact of the webinar on business. It helps the business in pursuing the below goals:
- Lead Generation
- Customer Acquisition
- Customer Engagement
- Revenue Impact of the webinars
- Assess the success of the webinar
|
Goals |
Questions to ask |
Dashboard views |
|---|---|---|
|
Lead Generation |
How many people registered for the webinars? Of this, how many attended them? |
Registrations & Attendees |
|
Customer Acquisition |
How many new customers were acquired as a result of the webinar? |
Attendee to conversion ratio |
|
Customer Engagement |
Were the webinars successful in retaining the audience? How many left before the pitch? |
Avg Engagement time Avg Engagement score Engagement |
|
Revenue Impact |
Which was the most effective webinar? Which webinar created the maximum opportunities? |
Summary table Total Spend |
|
Assess the success of the business |
Did the attendees enjoy the webinar? |
Feedback |
- Attendees of the webinar are the warmest leads for the sales team. Usually, the contact information of all those who registered for the webinar is recorded for retargeting. If the registration count is low, it would mean that the webinar promotions were not successful in attracting the audience. If the registrant-to-attendee ratio is low, it will indicate that the company needs to revisit the post-registration processes.
- The engagement metrics tell the business more about the attendees who interacted with the webinar content. The preferences of the attendees, the features they liked or disliked about the products, the way they perceive the brand can all be understood based on the engagement metrics. Insights from this can be used by the sales and marketing teams for product development, launch and customer segmentation.
- The summary table compares the impact of various webinars. Comparing the Total Spend with Cost per Lead and Sales gives the effect of webinars on revenue.
- The most convenient metric to judge the success of a webinar is the attendee feedback. This can be used as input for planning the upcoming webinars.
KPIs
- Number of registrants & attendees
- Attendee to the converted ratio
- Total Spend, Total Conversion, Cost per Lead
- Database growth
- Avg Engagement Time & Score
- Audience Feedback
Conclusion
Webinars have become an important marketing tool for the business. The insights from the dashboard can be used to improve the current online event strategy of the business, helping the business take decisions in achieving their goals.