
Leveraging Analytics to master one of the key SaaS metrics – CHURN, has the potential to bring that lost revenue back on the table
Churn is a key business term used to refer to customers who end their relationship with the company. Analysing churn not only includes knowing churn rate but also why it so happens, who are my churning customers and how can it be reduced.
As similar as it may sound but Churn Analysis is not the same as Churn Prediction. While the former helps understand the why part of churn, the latter forecasts the likelihood of churn based on historical data and feedback scores to help companies plan for times ahead.
Key Terms:
- Churn Rate – Percentage of customers that stopped using a company’s product or services during a given period of time
- Revenue Churn – Percentage of total revenue/MRR that was lost due to churned customers during a given period of time
- Net Promoter Score (NPS) – Score to track customer satisfaction and loyalty. It measures the likelihood of customers recommending the product to others (ranges from 0 to 10).
- Average Session Time – Average length of an active interaction by the user on the website
- Login Frequency – Number of times a user logs into the website.
- Support Wait Time – Average time for which a customer waits before he/she gets a response from the support team
- Users – Unique visitors that land on your website
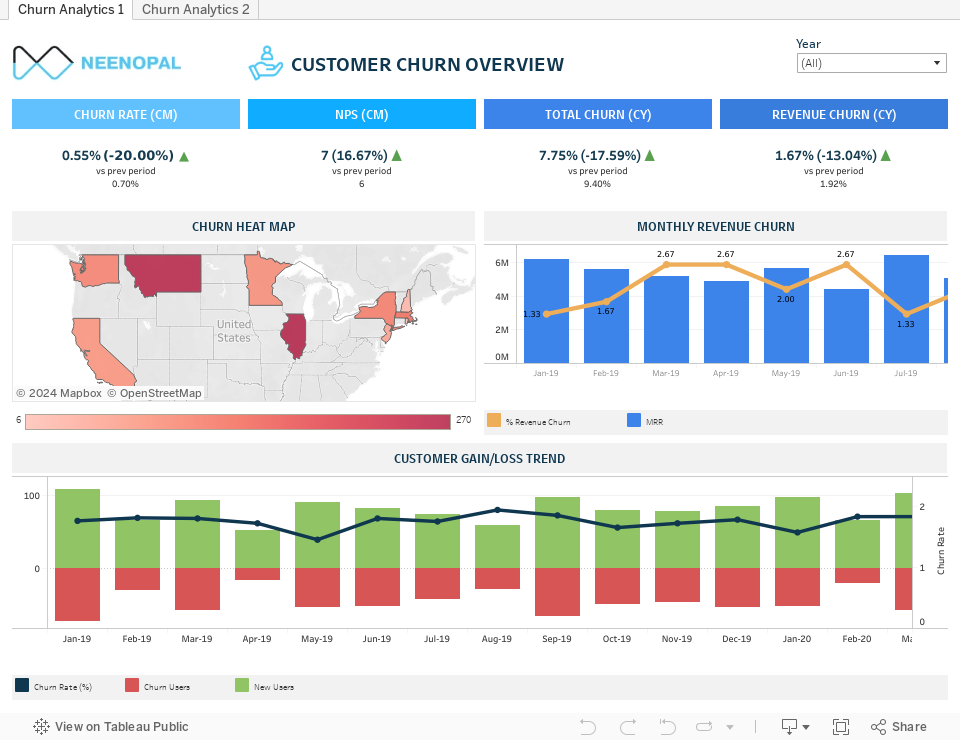
Customer Churn Overview
Every business deals with churn and most of the times it is much easier to save a customer before they leave rather than getting them to come back after they have left. So, it is imperative to take steps and act on abnormalities (as seen from dashboards) and prevent the risk of churn.
|
Goals |
Questions to ask |
Dashboard views |
|
Reduce customer churn and increase retention Minimise revenue churn Focus on the risky areas and build customer loyalty |
What % of MRR is getting churned due to lost customers? Which geographies are contributing to high churn? What is possibly going wrong? How is monthly churn varying? Is there a pattern that can be established? |
Monthly Revenue Churn Churn Heat Map NPS Customer Gain/Loss Trend |

- In a subscription-based business, a small rate of monthly churn can compound to a big number annually. For example – a 1% monthly churn can lead to about 12% annual churn rate.
- Revenue Churn is a huge indicator of growth potential. Comparing monthly customer churn with revenue churn, businesses can conclude if the retention is consistent throughout. For example, higher customer churn and lower revenue churn can indicate there is more churn with small customers. Similarly, lower customer churn and higher revenue churn can point at risky large customers.
- Based on geographical exploratory analysis, companies can identify a segment of customers that are most prone to churn. For example – states with high employment rates and higher median salaries might be less risky when compared to those with low median salaries. This can help companies predict customer’s needs and issues and define proper strategies to retain them
- Clicking on every region, other graphics change to highlight average churn rates, customer feedback scores, average revenue churn thus giving an overview of company performance.
Churn Analytics
Churn prediction is a process of identifying customers that are most likely to cancel a service. Since individualised customer retention is not possible given the volume of customers a SaaS business has, identifying customers at risk ahead of time through prediction can go a long way in retaining them with personalised efforts. With the help of historical customer data and ML models, one can answer the question whether a customer is going to leave in ‘X’ months or not.
Churn can be divided into 3 stages:
- Short Term Churn – Happens when users realise that the product is not a best fit for them during the onboarding phase.
- Medium Term Churn – Happens when users have used the product for a while but were not able to successfully integrate it with their processes.
- Long Term Churn – Happens when users leave the product after using it for a long time and could have stayed longer with upsell/cross sell of services.
|
Goals |
Questions to ask |
Dashboard views |
|
Predict customer churn Customer Segmentation Know your customer |
What features determine customer churn? Example- time spent on app, login frequency etc Are your customers promoters, passive or detractors? How long after do the customers cancel on the product. Are they short term, medium term or long-term churn type? How long after do the customers cancel on the product. Are they short term, medium term or long-term churn type? |
Summary Cards Churn Rate Predictions Sessions and users over time Passive, Promoter and detractor tree map Top Reasons for Churn Feature Usage |

- The first step to customer prediction is training the existing churn data to answer the questions of future. Based on customer, usage , support and contextual features of the past, a churn pattern is established using ML models.
- Customer churn can also be predicted based on NPS values. Promoters are the ones who gave score of 9-10, Passives are those with score 7-8 and detractors are those with scores 0-6. Detractors are least likely to recommend your product to others. The dashboard can be studied for each of the customer type by clicking on their respective tabs.
- Churn prevention can be targeted differently for different customer segments. For example – for short term user churns, onboarding can be world-class; for medium term user churns, frequent feedback and goal monitoring; for long term user churns – understanding what extra customers need. These tailor-made strategies can prove to be very effective in retention.
- Website performance and user engagement can be tracked through the topmost chart. This is specifically useful in tracking the onboarding experience of customers and how often they visit the website.
Conclusion
Businesses that better understand the causes of customer churn will always be adequately positioned to outsmart their competitors. The ability to select the most significant features that cause churn can enhance the prediction accuracy and help companies take the right call at the right time to proactively reduce churn.