
New companies are emerging everyday, giving cut-throat competition to all the players in the industry. With the increasing number of competitors, it becomes critical to build strategies to attract more customers.
It is important to find those people who are interested in your product, communicate with them, explain what you offer, and nurture this new relationship, so they finally become your customer!! This makes lead generation and nurturing one of the topmost priorities of every business.
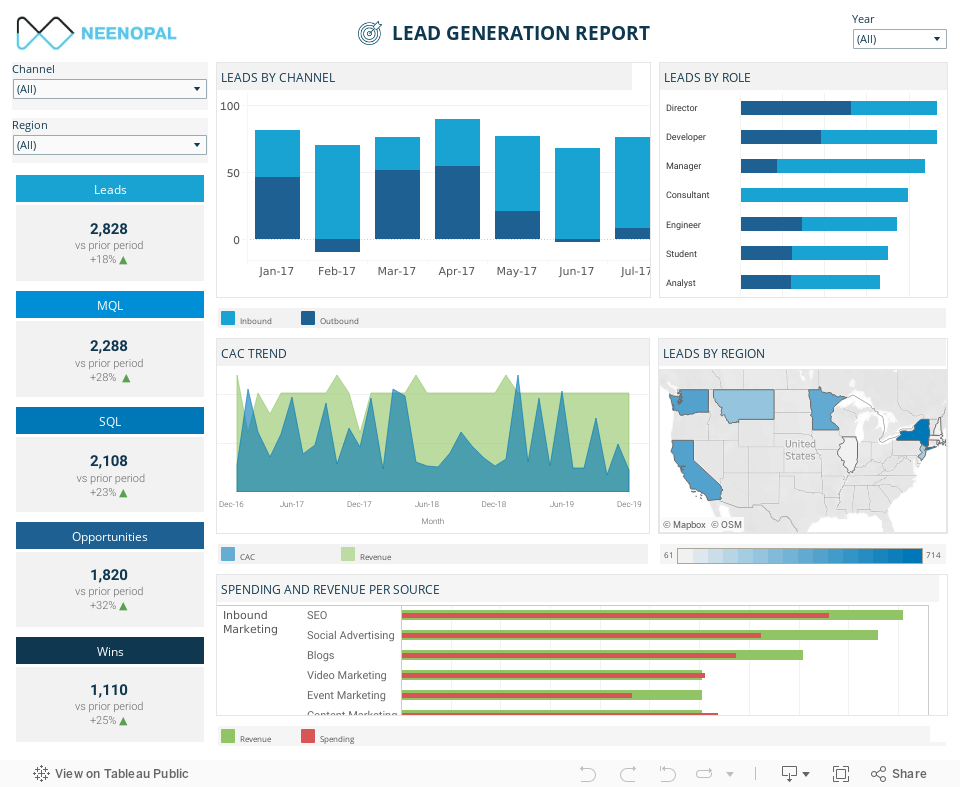
This dashboard tracks the journey of a lead to a customer, the cost involved, and the revenue generated from this. It also closely looks at the channels of the lead, the roles and the regions where leads are generated. It also identifies opportunities to achieve the below goals:
- Tracking the customer journey
- Evaluating the effectiveness of the current marketing plan
- Understanding leads – by region, channel, role
- Identifying the customer acquisition cost trend
Key Terms:
- Leads - Contacts that come from marketing efforts and express some level of interest in the product
- MQL - Marketing qualified lead is someone who engages with your content
- SQL - Sales qualified lead is someone who is ready to be engaged with direct sales.
- Opportunities - Someone who is likely to become a customer.
- Wins - Someone who purchases your product.
- CAC - Customer Acquisition Cost is the cost related to acquiring a new customer
| Goals | Questions to ask | Dashboard views |
| Track the customer journey through the sales funnel | What is the customer conversion rate? | Leads, MQL, SQL, Opportunities, Wins |
| Evaluating the effectiveness of the current marketing plan | Which sources generate less revenue than the amount spent for campaigns? Which are the most profitable sources? |
Spending and Revenue per source |
| Identifying the CAC trend | When did the acquisition cost go over the revenue? When was it the least? | CAC Trend |
| Understanding leads – by region, channel, role | Which regions, customer roles and marketing sources are contributing to most revenue? | Leads by Channel,Role,Region |

- The marketing funnel on the left of the dashboard divides the entire customer journey into five stages. The marketing spend as well as other resource utilization will differ based on these stages. Also, this division helps in identifying the point where the leads get dropped from the funnel, so more focus can be given by the marketing team on what went wrong in that particular stage.
- The effectiveness of the current marketing strategy can be seen from the spending and revenue per source chart. If a particular source is unable to generate revenue more than the cost spent on it, it is an indicator of a failed market plan.
- Identifying which channel, role and region generate the maximum number of leads is important for the marketing plans. It helps in deciding where the current plans have failed and where more focus is needed in the future.
- Being too conservative with how much to spend on CAC can lead to missed opportunities for revenue and customer growth, but being too reckless with it can often lead to critically low profits.
KPIs
- Leads
- MQL, SQL
- Opportunities, Wins
- Leads by Channel, Role, Region
- CAC Trend
- Spending and revenue per resource
Conclusion
An effective lead generation funnel makes it possible to generate high quality leads and convert them to sales. The insights from this dashboards makes it easier for the business to analyse their funnel, nurture the leads and convert them to potential customers.


