How Data Analytics is Set to Revolutionize the Upcoming U.S. Presidential Elections?
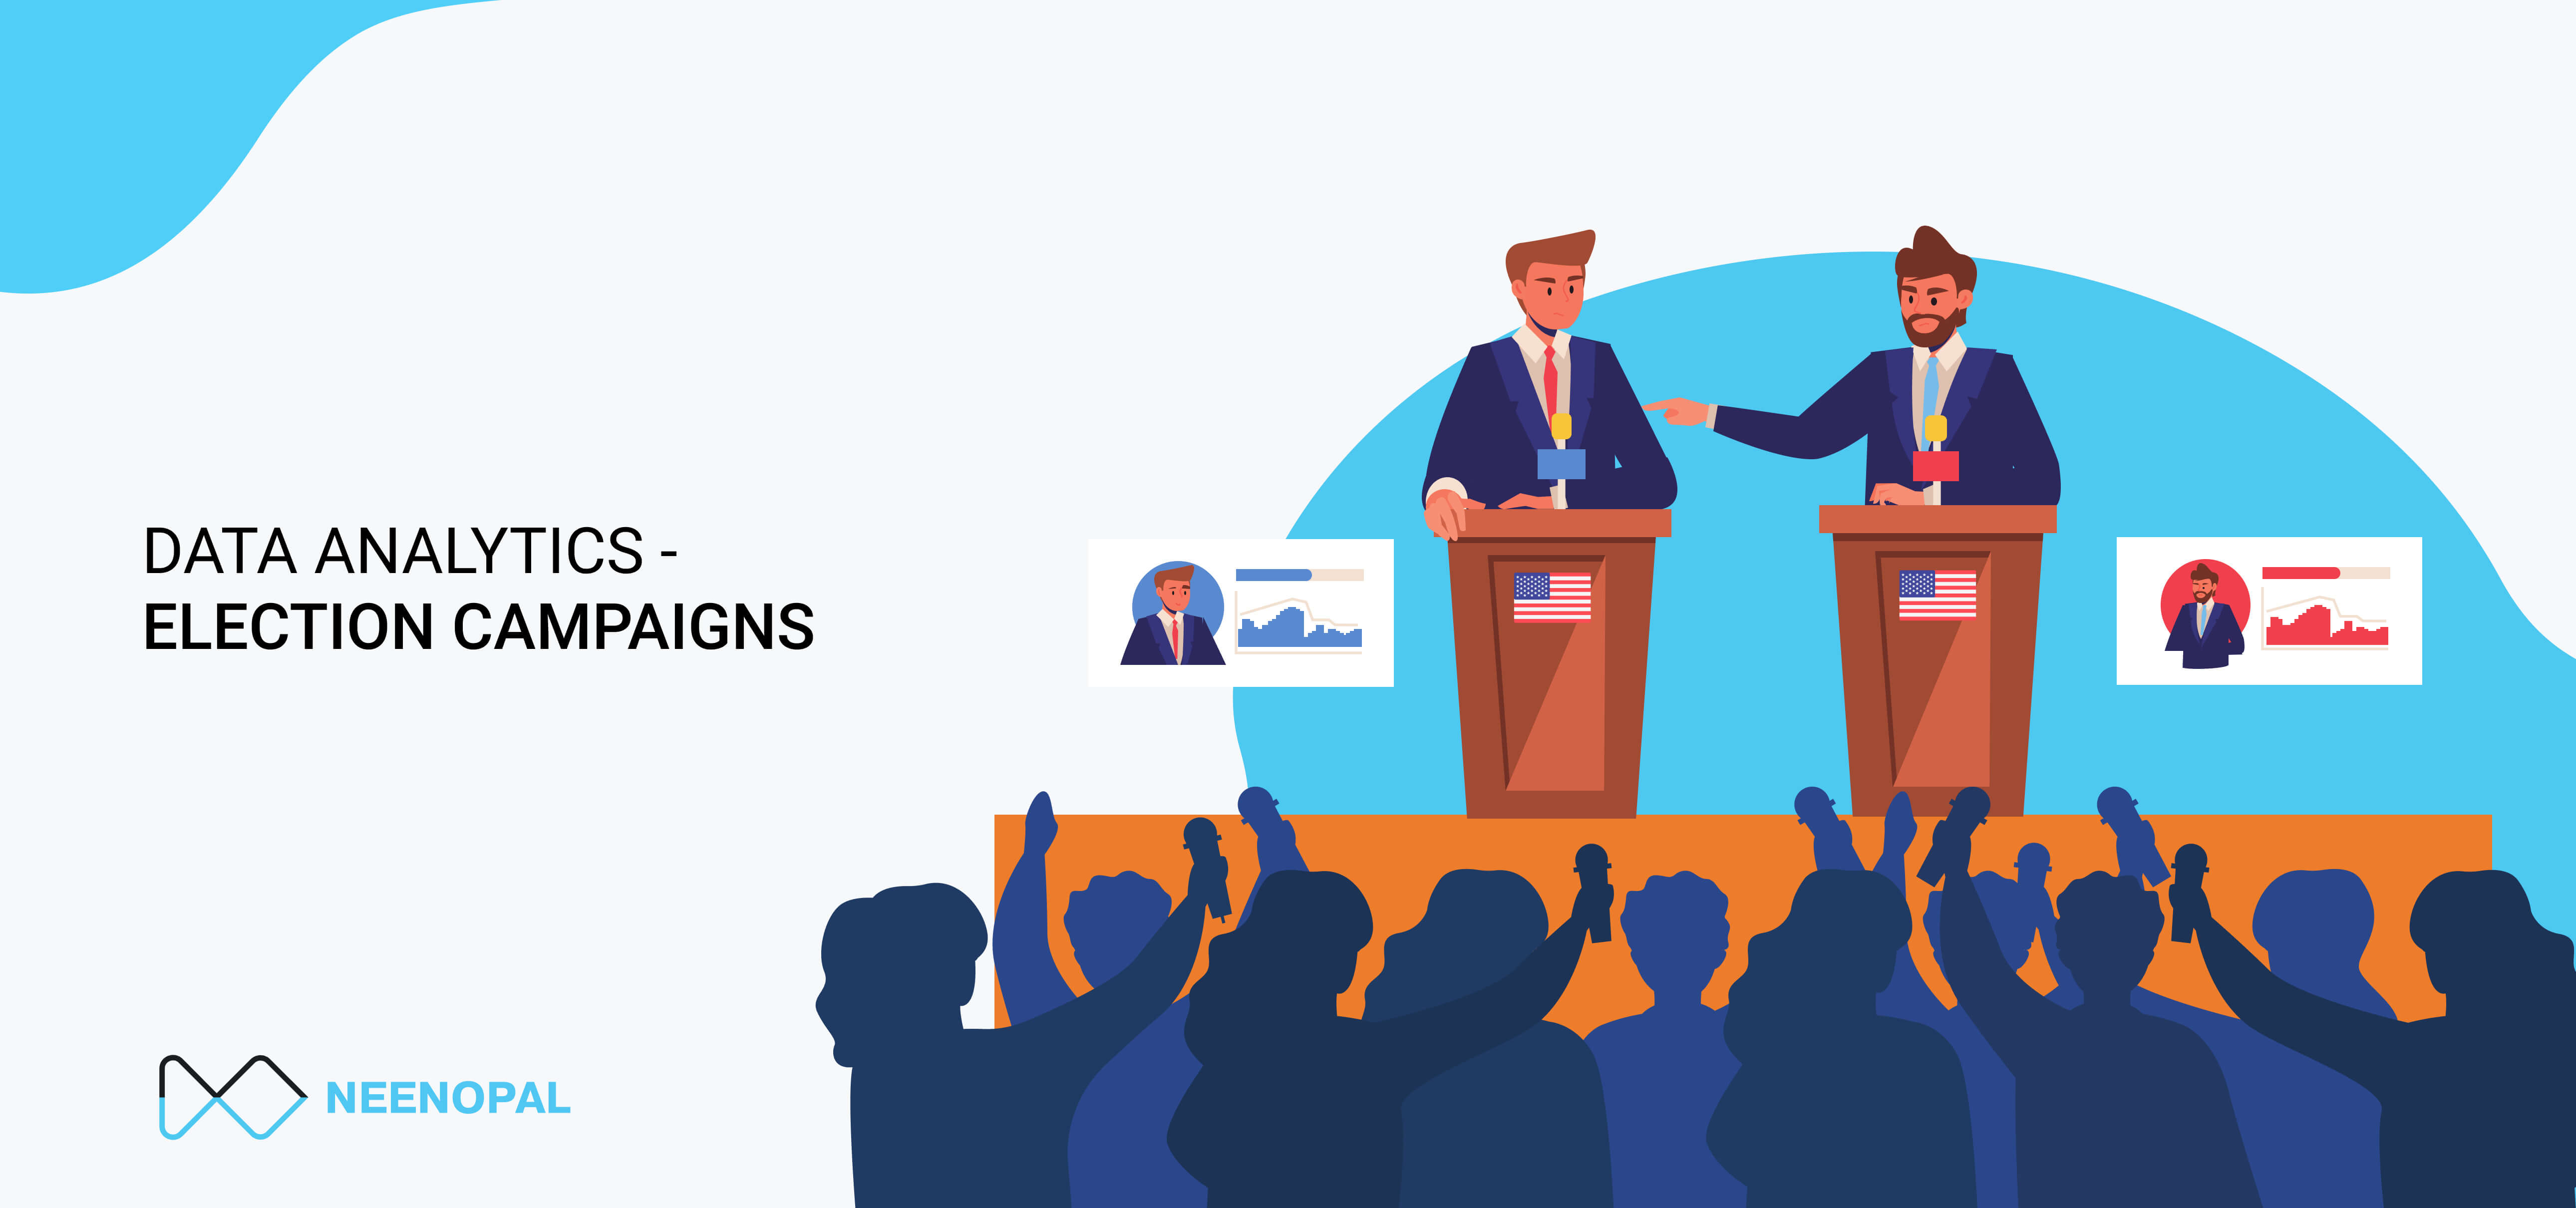
Elections today are no different from a business. There are more than 50,000 elected officials in the U.S. The winner is determined by who does the best marketing, aka campaigning, before the elections. The upcoming US Presidential elections are more important because we are witnessing a unique moment in the U.S. political history with the Covid-19 pandemic spread, nation-wide George Floyd protests, high unemployment, and a depression staring around at the corner. All these factors make the upcoming Presidential elections very unpredictable.
Presidential elections have always been a costly affair. To win, candidates end-up spending a lot of money on electoral campaigns. However, money always does not guarantee victory. E.g. In the 2016 U.S. Presidential elections, Trump spent almost half of what Clinton spent on campaigns. We all know who won. Still, candidates often end up leaving no stone unturned and hence spend a lot of money on campaigns.
The following visualization shows how much U.S. Presidential candidates spent on their campaigns over the last 40 years (from 1980 to 2016)
In recent times, campaigning has become highly targeted, to the point that it can be narrowed down to the voter level. The first instance of the sweeping success of effective data science was in the 2012 US Presidential elections. Barack Obama’s data analysis machinery Project Narwhal, which had been rolling for 18 months, was a big factor in his win against Mitt Romney. Romney’s Big Data project Orca was a case study in how poor planning and management can ruin lofty dreams of riding technology to victory.
But this was not the first-time data analytics was applied to the election campaigns. Obama himself had used it in his 2008 run for President, backed by his team of 100. But it is not all rosy on this front. The entire Facebook-Cambridge Analytica fiasco was a good example of how data science can be weaponized to target voters and sway the electoral trends in favor of a candidate. They had been involved with multiple US elections even before the Ted Cruz and Donald Trump campaigns. Just as Big Data can aid people in good hands, it can do substantial damage in the wrong ones too.
Application of Data Analytics in Elections
Data analytics in electoral campaigning uses the same method that marketing and sales forces use to generate and convert leads - profiling. The psychometric analysis of voters is quite easy nowadays. People lead open lives and provide social commentary on social media platforms. The large volumes of data thus obtained are fed into a repository. Analytical and statistical tools sort, organize and interpret this data into useful information. Where do I have the majority support? Which are the swing states? What are the major demands of the people in the states I have minority support in? Based on this data, the campaign is planned to target each demography with the kind of advertisement that would convert non-supporters and solidify the existing supporting voter base.
The case of Cambridge Analytica is the strongest. They used a quiz called “This Is My Digital Life” to use 270,000 people’s profiles as channels to gain access to data on 87 million Facebook users. Based on their needs, aspirations, and fears, the company crafted “dark posts” targeted towards people based on their behavior that did not show up on the dashboard of users in a different profile category.
How Effective is the Data Analytics Approach
It is quite ironic that Trump, who has always considered data science as “overrated”, won on the foundation of data analytics and, particularly, the micro-targeting of Facebook users. In what is the most shocking turn of events, Hillary Clinton lost to Trump despite polling data predicting Clinton to have a 3% margin over him. There were several reasons for this. Clinton’s data science team worked mostly on the votes they already had. In contrast, Trump’s people worked on the opposition and floating voters. His team spearheaded a campaign of presenting to them exactly what would convert them to his side. Moreover, Clinton spent too much of her energy antagonizing Trump supporters, which only added fuel to the fire that Trump’s campaign had started. Pollsters were also plagued by misinformation. Many people lied that they would vote for Clinton because they were ashamed to openly support Trump. While Cambridge Analytica detected this in time and exploited this silent voter base to their advantage, Clinton’s team believed it blindly. 84% of Trump’s digital ads featured bold CTAs for donation, liking, and sharing, compared to only 56% in Clinton’s.
It is ironic that although Clinton raised as well as spent nearly double of what Trump did, she failed to mobilize the money the right way. Also notable is that Clinton’s staff size was seven times that of Trump, so even though she had only 15.2% of them in data analytics, it was still a much bigger number than Trump’s 38.5%. And once again, surprisingly, for a candidate who is a staunch believer in the power of data, Clinton spent only $22 million compared to the $33 million of Trump, who’s vocally anti-tech, on data research, analytics, and management.
Swing States - From Obama to Trump
It is common sense that an election with a narrow margin is decided largely by the outcome in the swing states. Obama harvested the power of influence over swing states to its full potential in 2012. In 2016, there were 11 swing states: Florida, Colorado, Iowa, Michigan, Minnesota, New Hampshire, Nevada, Ohio, North Carolina, Pennsylvania, and Wisconsin. Trump won Florida, Iowa, North Carolina, and Ohio, while Clinton won in Colorado, Nevada, New Hampshire, and Minnesota. But the states that sealed Clinton’s fate were Michigan, Pennsylvania, and Wisconsin, where Trump won by the thinnest of margins.
Clinton’s campaign missed this aspect tangentially. It is not that she ignored the swing states; rather she considered them one big pool instead of micro-targeting them as Trump did. That was the whole point behind the psychographic analysis performed by Cambridge Analytica. It identified and grouped opposition and floating voters based on their online behavior. They identified other identically thinking users from the profile of one and kept the chain going. As a result, the promotional activity was far more active than Clinton’s, who simply put out a generic ad campaign. To get an idea of just how targeted Trump’s campaign was, look at the number of variations of digital ads he put out: 5.9 million against Clinton’s 66,000. Jared Kushner, Trump’s son-in-law and his digital media strategist in the 2016 race, had used real-time A/B testing results analysis to craft a digital promotional campaign that was verified to be effective.
The following visualization outlines how U.S. states voted in Presidential elections since 2008 – (click on the ‘next’ button)
Prediction of Results
If there is one belief that got overturned in the 2016 Presidential elections, it was the accuracy of the prediction of results from the primaries and polls. In the primaries, even Bernie Sanders (1893), who was way behind Clinton (2807), was ahead of Trump (1542). The polls too yielded comparable results. And that is where the downfall of Clinton lay. The results of the sweeping success in the primaries resulted in more people thinking, Clinton would win anyway, I can spend the day at home, on Election Day. And the polls included many silent voters, who, as we said, were embarrassed to reveal their allegiance to Trump. On top of that, Trump’s $4.96 billion worth of free media coverage compared to Clinton’s $3.24 billion was also to blame. Yet, the Primary Model and Nate Silver’s Five Thirty-Eight predicted the results accurately.
Future of Elections
For the past few elections, the voter turnout has been around 50-55% for the U.S. presidential elections. One of the ways of increasing this turnout is to conduct online voting using the internet. Cybersecurity issues have been so far the major hurdle to shift to online voting in the U.S. However, there are a few countries like Estonia which have been using online voting for a decade now. Because of the lack of a federal infrastructure for U.S. Presidential elections, the problem becomes more complex since every state has its freedom in deciding how elections are conducted. Despite such issues, there are many advocates of conducting the elections online, and in the future, we may see voters casting their ballots online in U.S. Presidential elections.
Concluding Remark
The upcoming 2020 elections are, for lack of a better term, a mess. First, the Coronavirus pandemic, and then, the Black Lives Matter protests, have rocked the American political scene. While the popular vote has shot Joe Biden to the top, it is hard to trust the polls again, especially at a time many Trump supporters would preferably hide their true allegiance. Trump’s Tulsa rally was a great example of how deceptive numbers can be. The primaries have been pushed back too. But, it seems the selective and systematic suppression of voters is still on. Voter rolls purging, uninformed registration cancellations and caging, prevention of absentee voting, and targeted dissemination of disinformation was rampant from mid-2019 well into 2020. This is one election that will be very hard to predict, even with cutting-edge data analytics.


