
Coupons are a clever tool used by the business to incentivize the hesitant shoppers to finally click the buy button.
It attracts new customers and can also push the past purchasers to place the next order. They can be instrumental in clearing the excess inventory load and boosting customer happiness and loyalty.
Though coupons bring in traffic, it comes with certain risks. Selling products at lower prices can lead to a low perceived value for the product, leading to customer attrition. It can also have a severe impact on the profit margins. It is crucial to target the right audience at the right time with the right terms and conditions. This increases the necessity of data-driven Coupon strategy planning.
The Coupons dashboard monitors the performance of coupons over time and tries to identify opportunities to achieve the below goals:
- Increasing revenue by attracting new customers
- Increasing revenue from repeat purchasers
- Maintaining the optimum discount
- Comparing the impact of existing coupons
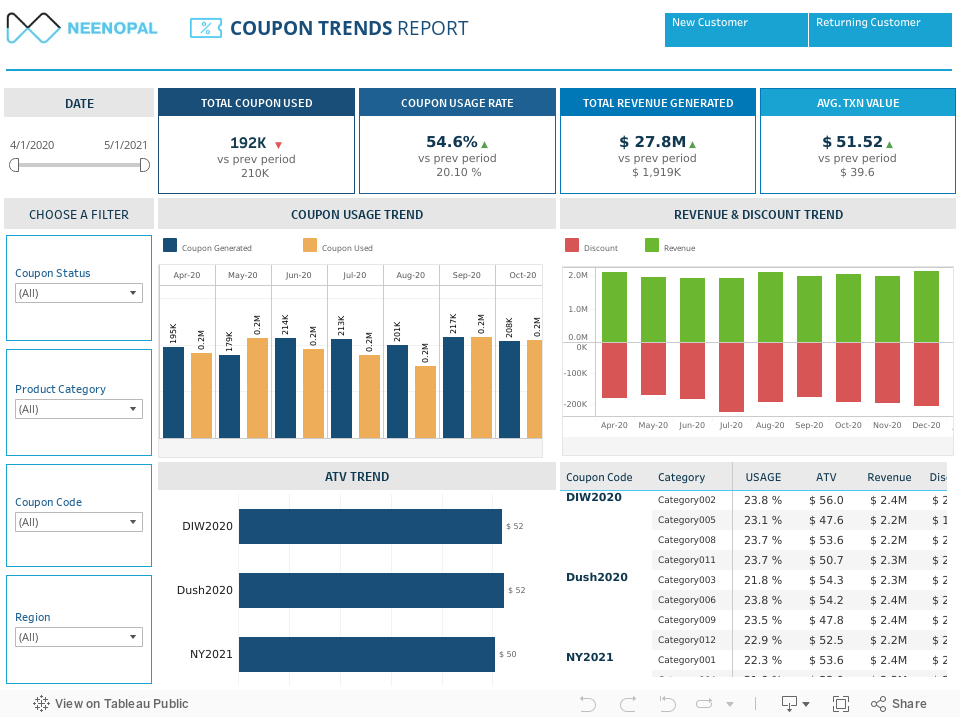
The values corresponding to above goals are measured across all regions and product categories, making it critical for planning the future marketing strategies of the company. The user could select the time period, the product category, coupon status and coupon code for which he wants to view the data.
The dashboard has two views - new customer and returning customer. All the data can be viewed according to these categories and comparisons can be drawn for understanding the behaviour of the existing and the new customers
A high-level view of the four most important measures – total coupons used, the coupon usage rate, total revenue generated and the average transaction value, compared to their previous period gives a snapshot of the progress of the current coupon management strategy.
| Goals | Questions to ask | Dashboard views |
|---|---|---|
| To understand the effectiveness of current coupons strategy. | Is the current coupon strategy successful? | ATV Trend |
| To understand the reach of coupons to users. | Is Couponing growing or slowing? | Coupon Usage Trend |
| To compare the existing coupons and draw insights for future planning. | Which coupon is doing the best? | Coupons summary Table |
| To ensure the discount rate given is optimum. | Is the discount given too much or too less? | Revenue & Discount Trend |

- If both ATV and revenue are not on the higher side than the previous period, it may be an indicator to revisit your strategy. The best way to analyse the impact of the coupon strategy is to check its effect on revenue and the Average Trend Value (ATV). ATV is the average amount a customer spends with the business in a single transaction. It helps to evaluate ROI and determine the product and pricing strategies.
- The coupon usage trend gives an understanding of the number of coupons used out of the total coupons generated over the selected time period. This helps in understanding the seasonality in coupon usage.
- The summary table compares the existing coupon on parameters – Usage%, ATV, Revenue and Discounts. This helps in identifying which are the coupons most used by users and those that bring in maximum revenue.
- While a coupon has many benefits, one should always be careful about the discount offered. A high discount may lead to low profit margins and further perception issues among customers. So, a revenue versus discount check is necessary for setting the optimal discount rates.
KPIs
- Total Coupons Used
- Coupon Usage Rate
- Total Revenue
- Average Transaction Value
- Discount
Conclusion
Coupons often push users to buy the same product from the company’s website when the competitor offers the same product at the same price. Analysing the coupon trend and planning the market strategy accordingly is very important for gaining competitive advantage.


